
Problem
People with money in several places run three or four banks, a couple of cards and some investments. They could not line those up against each other, they did not believe the categories their apps assigned, and they could not see what one purchase would do to the rest of the month. The apps they had drew charts and left the decision to them.
That made it a trust problem before a charting problem. People check a finance app against their statement, and they keep checking until it has earned the benefit of the doubt.
Research
Everyone I studied checked the app against their bank.
Eight people with multiple accounts kept a diary for two weeks. The same ritual showed up in all of them: open the app, read the total, open the banking app to see whether the total was right. So I moved reconciliation out of a settings page and built the product around it.
Process
- DISCOVERDiary studies, competitive audit of Mint/YNAB-class tools, tax-workflow interviews
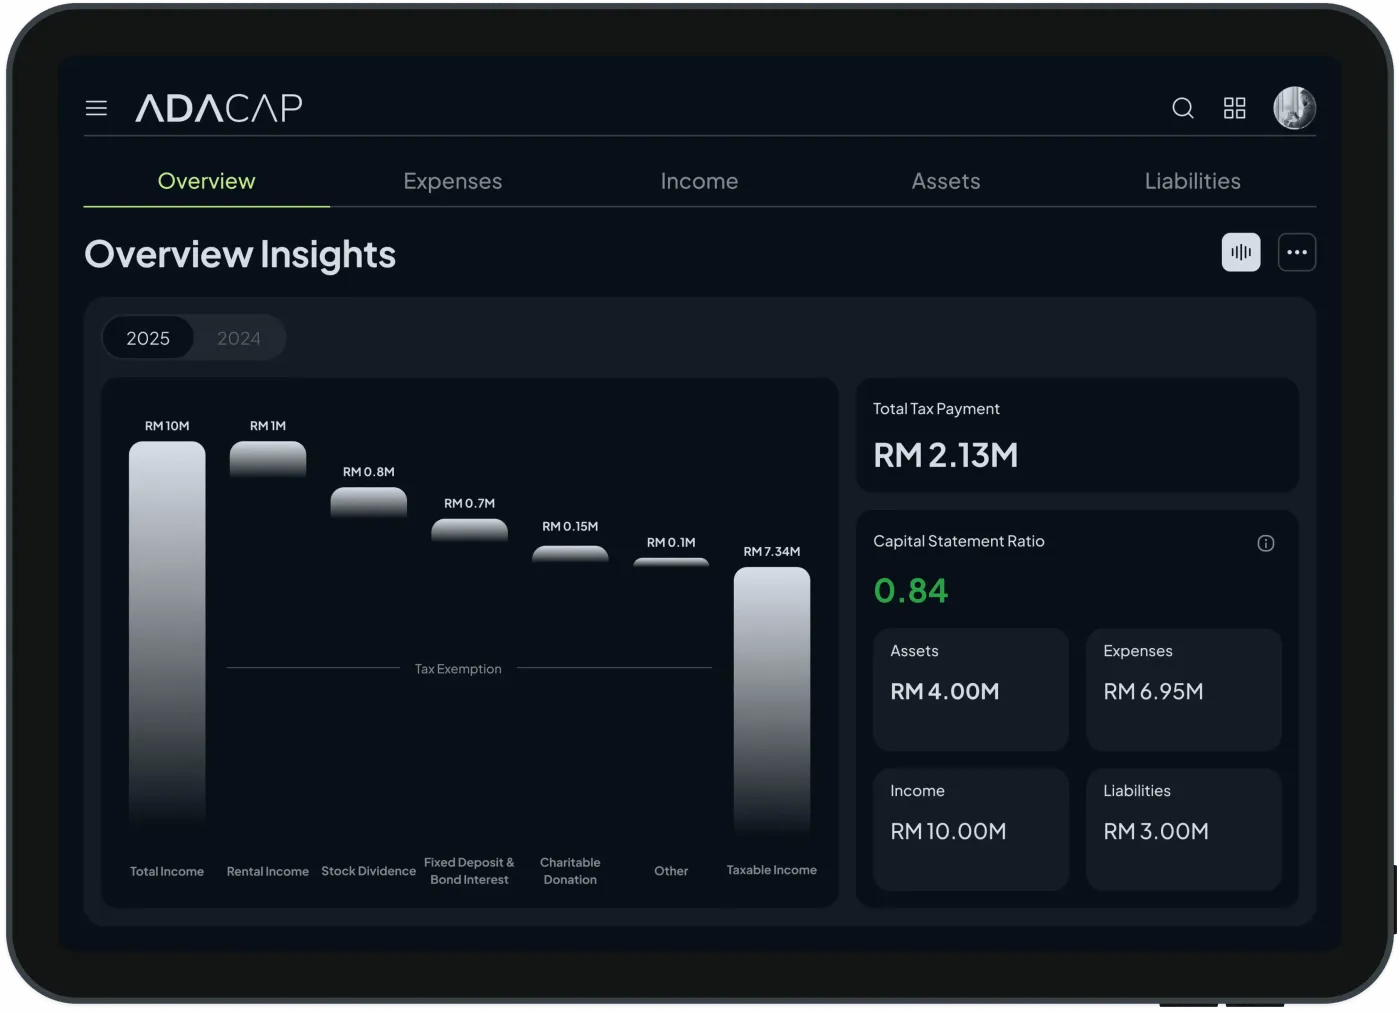
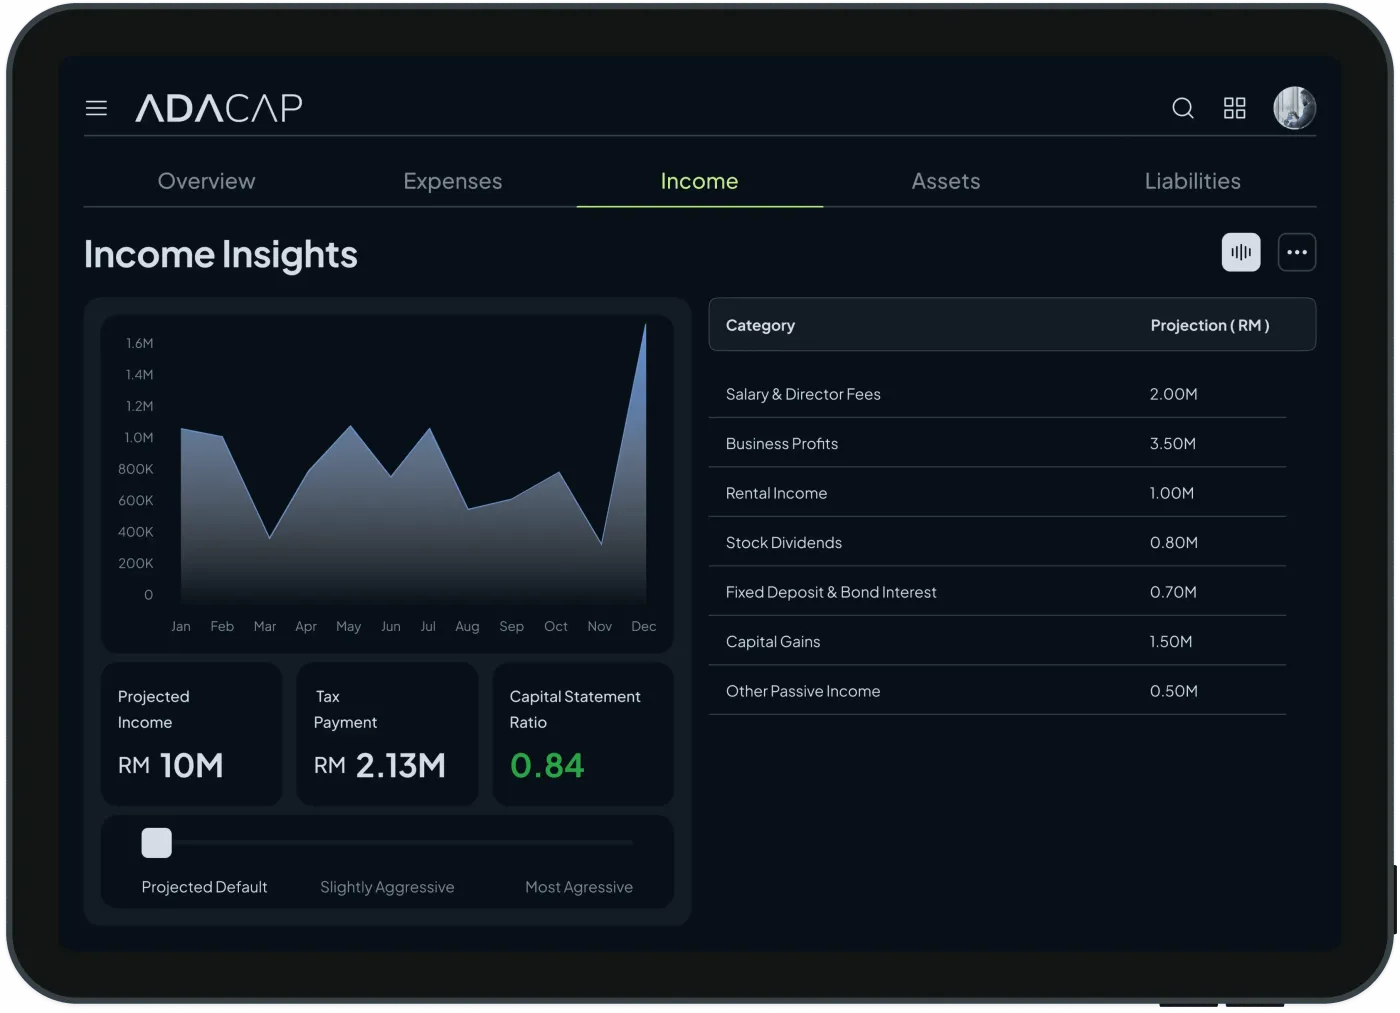
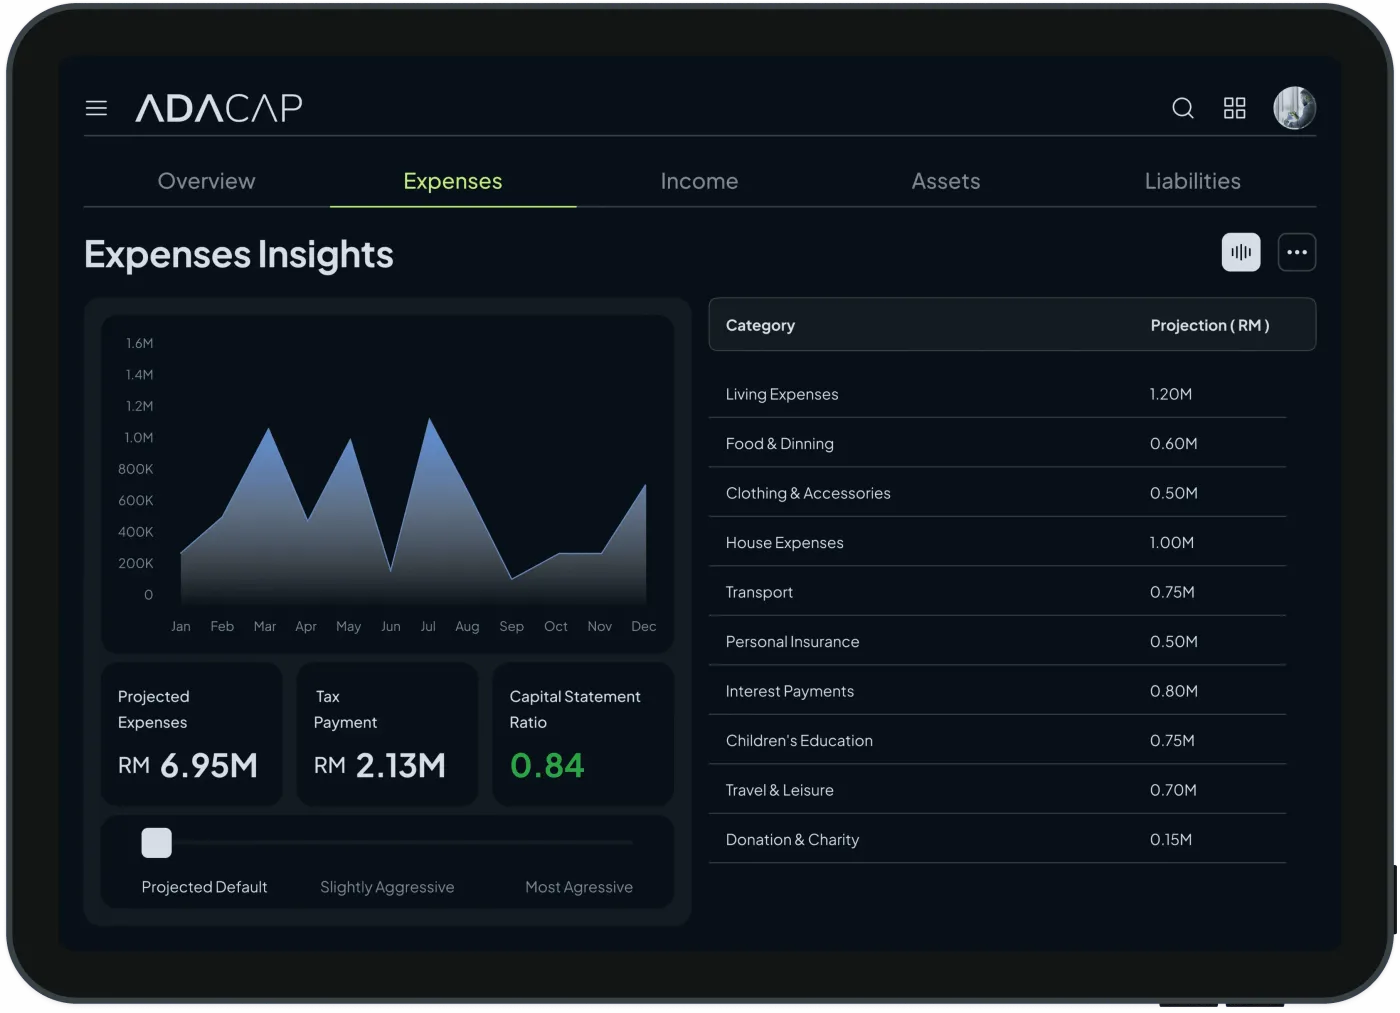
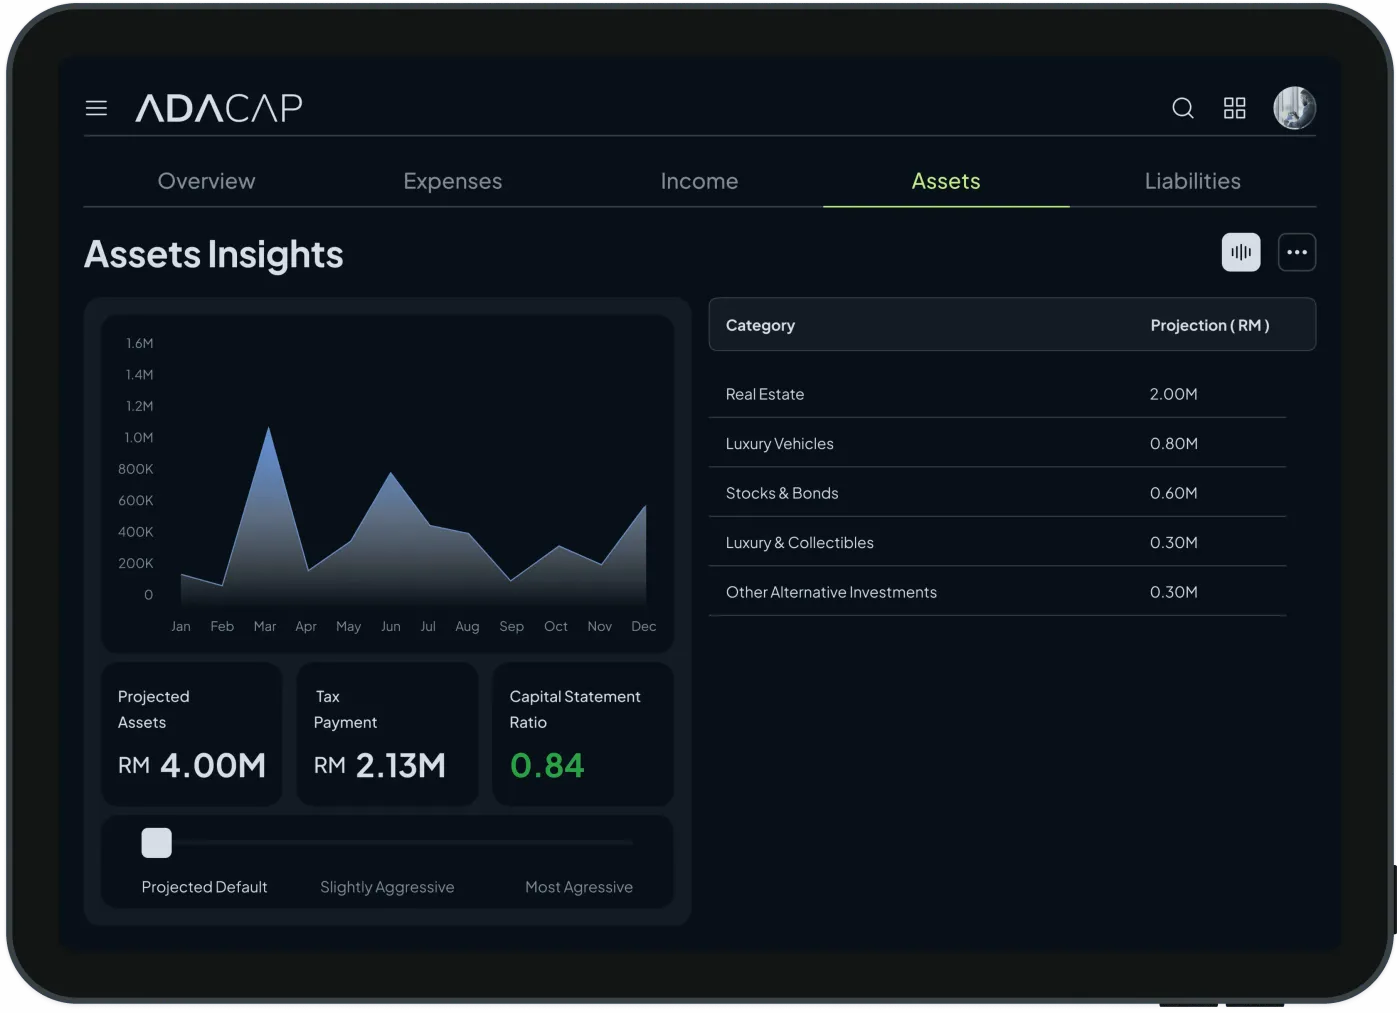
- DEFINEOverview → drill-down architecture; five money categories, one visual grammar
- DESIGNDesign system first, then 8 insight modules built from its tokens
- VALIDATEReconciliation flows tested against real statements; category trust measured
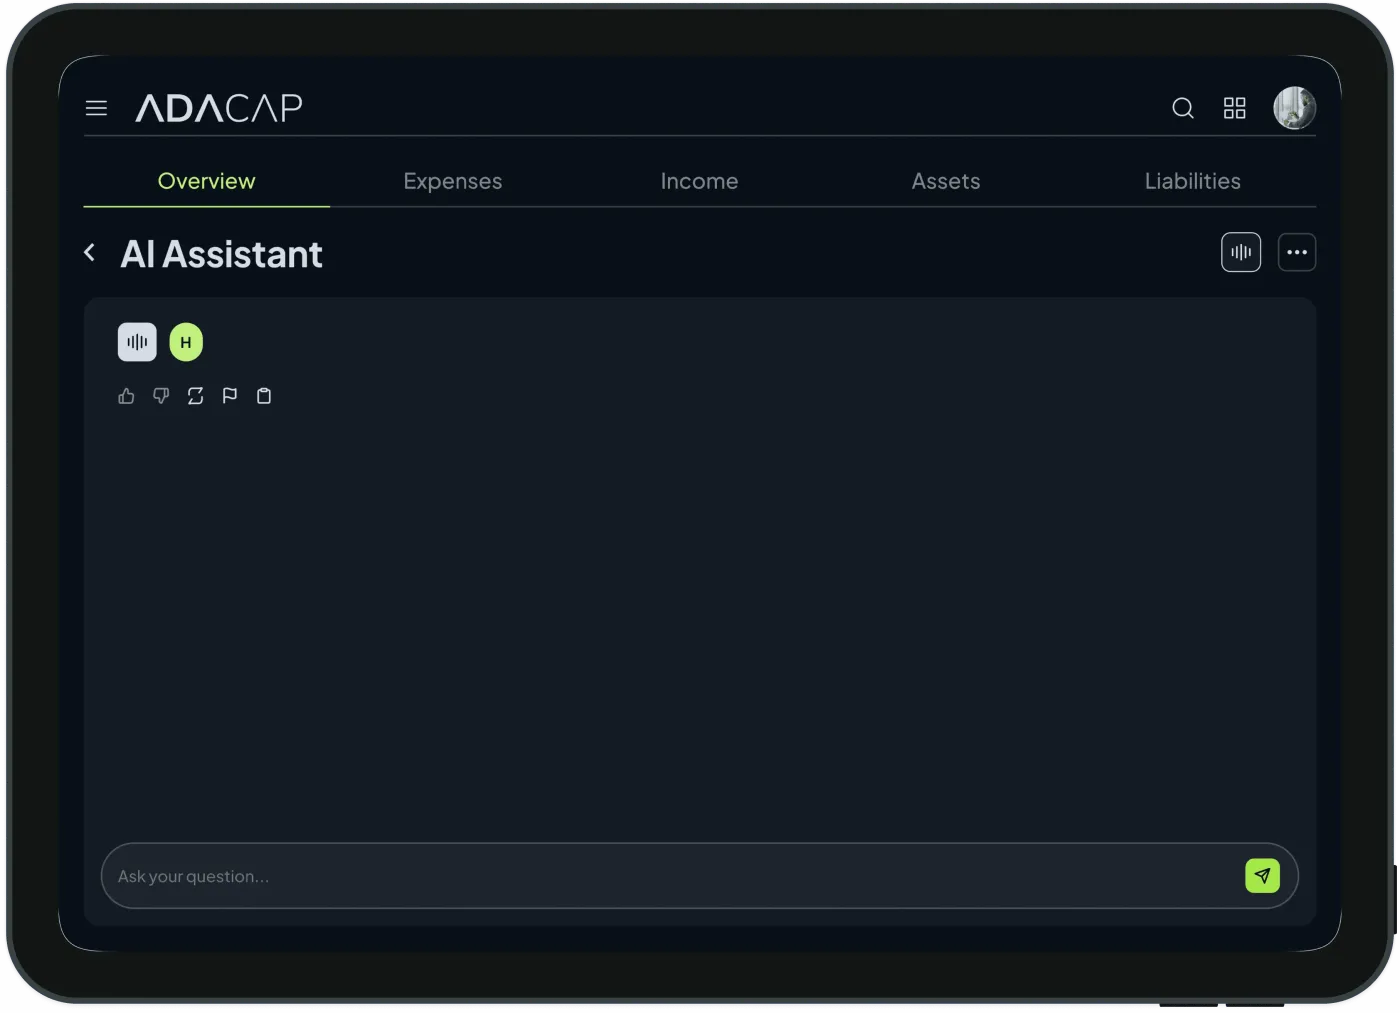
- SHIPHi-fi handoff with documented system; AI simulation and assistant layered last
Decisions
Start with the whole picture, keep transactions one tap below.
A top-down financial view that opens into the individual transactions behind any number.
Power users wanted more on the first screen. In testing the sparser version won, so that is what shipped.
One visual system for five kinds of money.
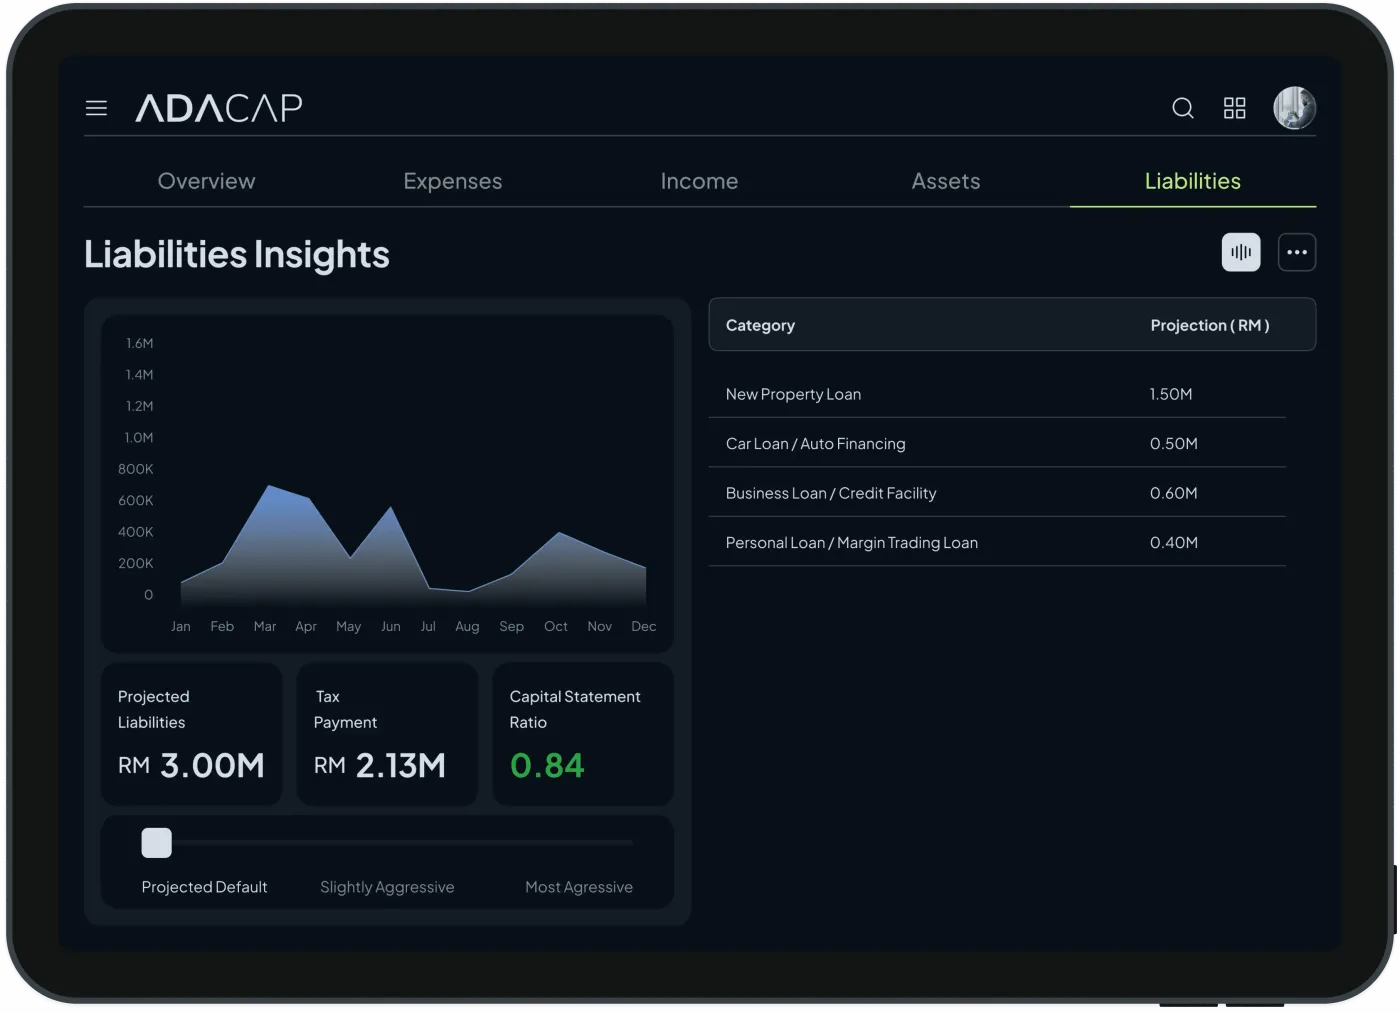
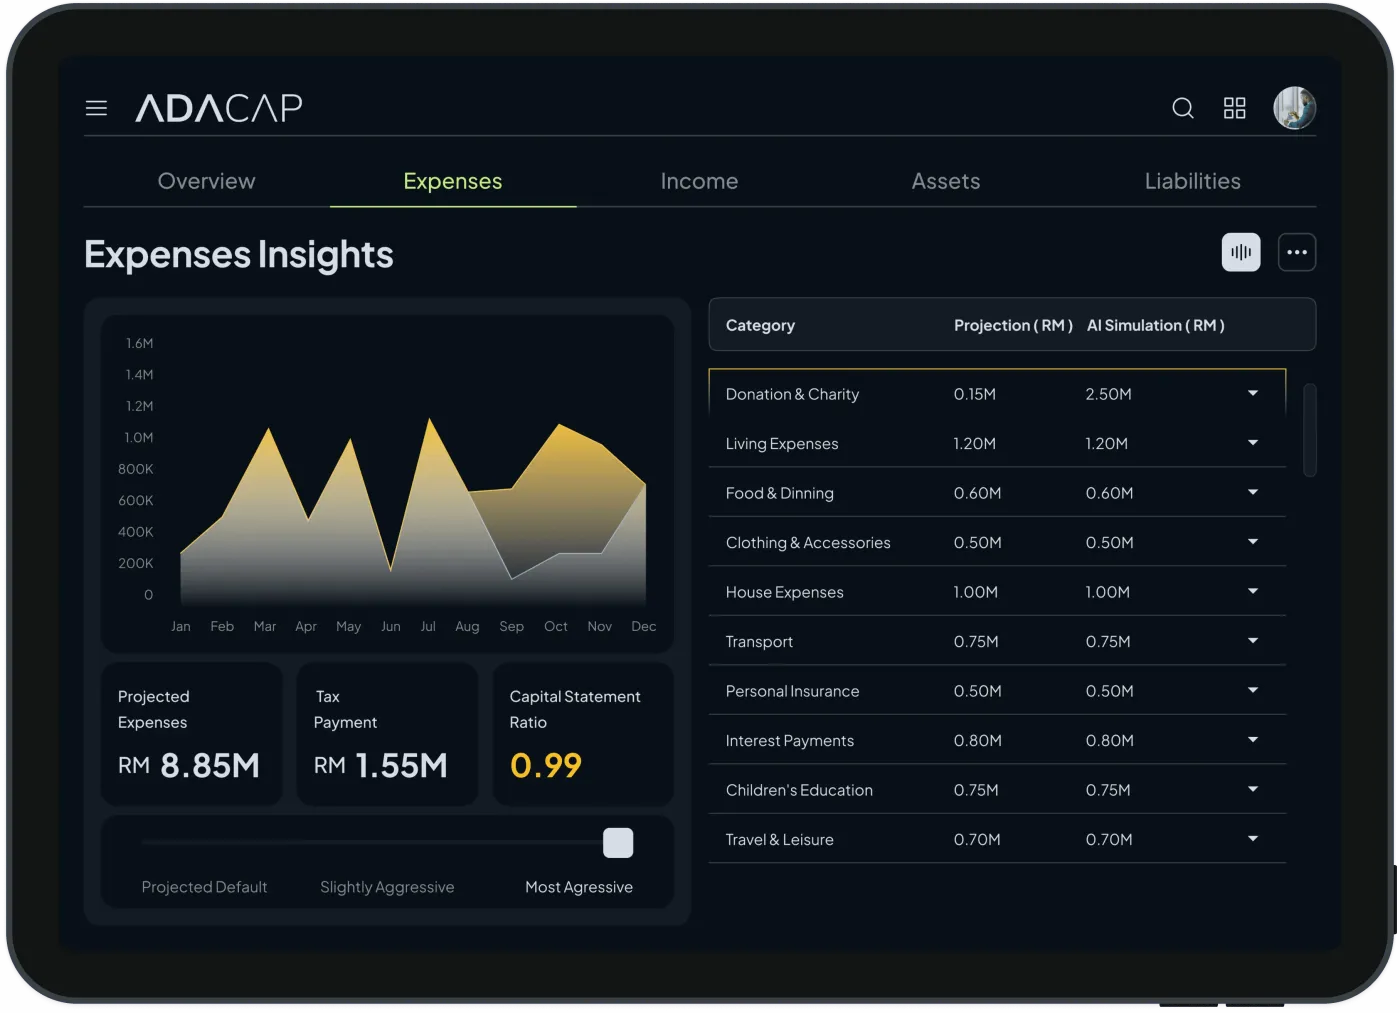
Income, expenses, assets, liabilities and tax share the same components, colours and chart grammar.
Some categories lost the colour people expect them to have. Everyone in testing compared categories against each other, and one grammar made that easier.
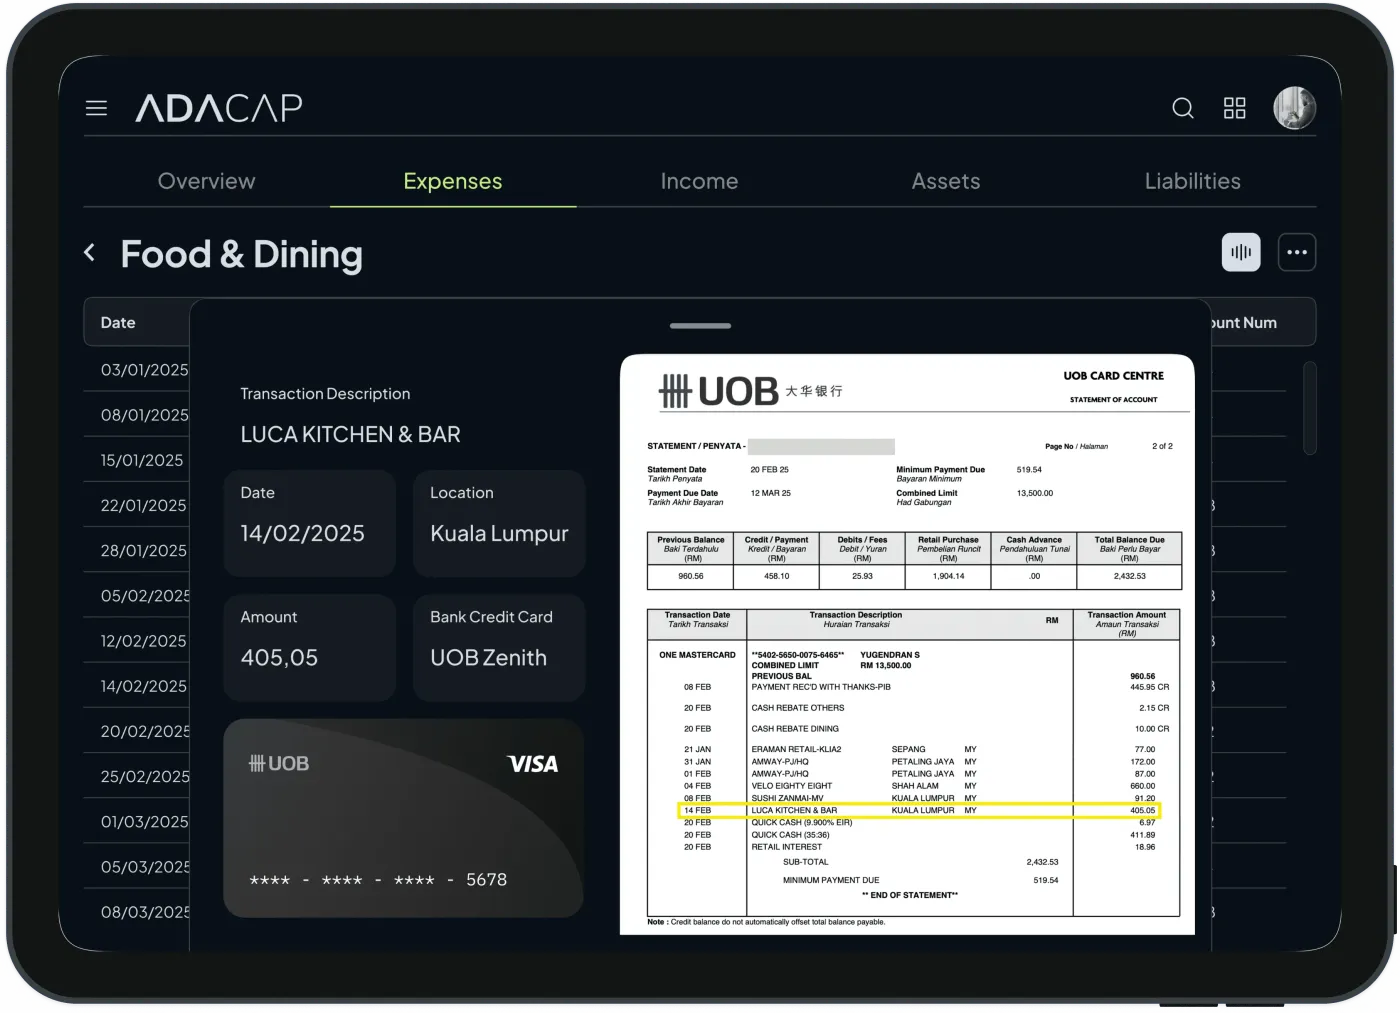
Reconciliation is a first-class screen.
Statements read line by line against the bank, with mismatches flagged where you will see them.
It added real engineering scope. It also did more for trust than anything else in the product.
PrototypeTap the glowing hotspots to move through the app, like the real prototype.
Before → After
Five apps and five totals that never agreed, categories nobody believed, and a monthly ritual of cross-checking bank PDFs.
One overview that opens down to the transaction, checks itself against the bank, and answers what-if questions on numbers you already believe.
Outcome
- Scattered accounts became one top-down view that opens down to any transaction.
- A documented design system holds eight insight modules in the same visual language.
- People can read a statement against their bank record line by line instead of matching it by hand.
- Projections, capital ratio and exemption breakdowns turn history into something you can plan against.
Reflection
Trust took more design work than the charts did. Next time I would measure how many people finish a reconciliation and how long it takes them, then push the forecasting views through messy real data from several accounts before layering the AI on top.